 |
The Astronomy and Astrophysics group in the Physics and Astronomy Department of the University of Glasgow holds the primary data from the New Cambridge IPS Survey (1990 to 1994). This unique data set comprises daily measurements of the scintillation (or twinkling) of approximately 800 extragalagtic radio sources distributed over the sky as seen from the Mullard Radio Astronomy Observatory, Cambridge, UK. These scintillations reveal density fluctuations in the interplanetary medium and can be processed to produce daily maps of the sky, highlighting regions occupied by unusually low or high density solar wind.
|
|
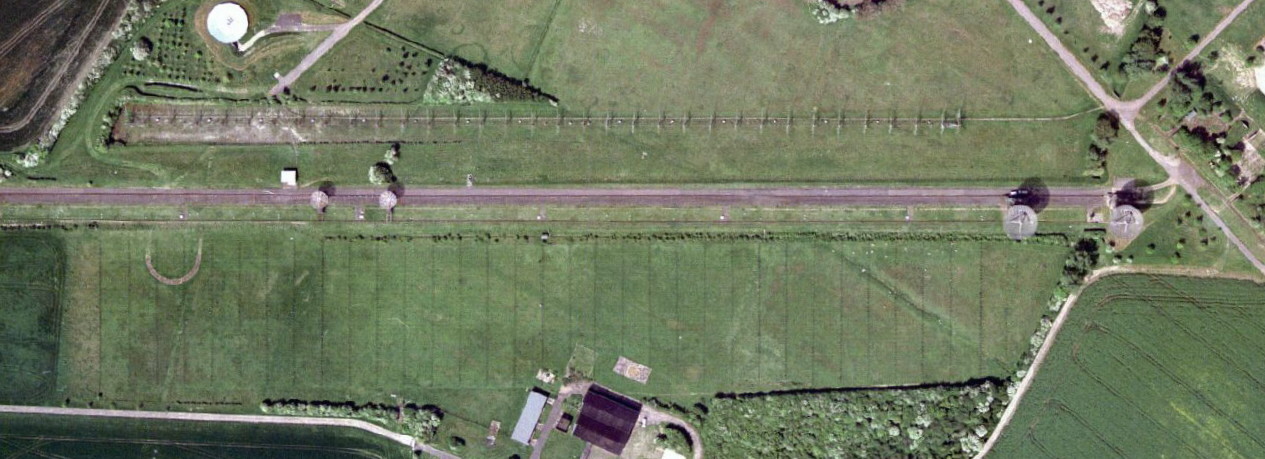
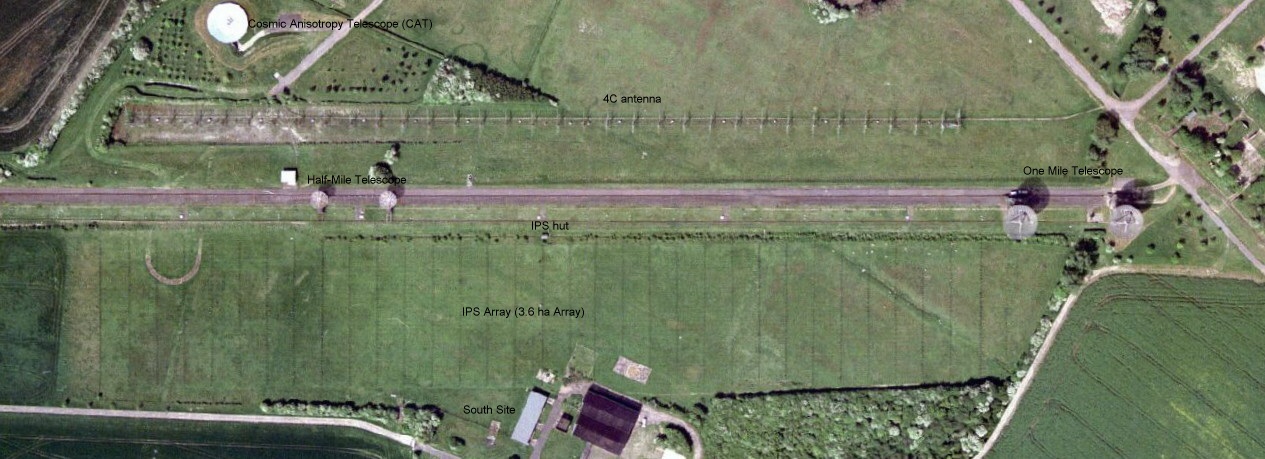
The measurements were made continuously using fully automated equipment connected to the 3.6 hectare transit array (pictured above) at the Lords Bridge observatory site near Cambridge. An observing frequency of 81.5 MHz allowed us to detect both transient and co-rotating structures in the solar wind at all solar elongations greater than about 30° and declinations greater than -7°.
Some of the processed data have been distributed to research groups
around the world, including The Space
Environment Laboratory at Boulder, Colorado, the Rutherford
Appleton Laboratory, Imperial
College, The British
Geological Survey and UCSD
(California). Prospective users of the data should contact Dr Graham Woan
in the first instance.
 |
As an example, here is an IPS image from April 1994, which shows the whole sky, as seen from Cambridge, in a Hammer-Aitoff projection. The ecliptic is shown yellow with the Sun at the centre. Scintillation is expressed as the index g on a logarithmic scale. Blue (low g) corresponds to low solar wind density and red (high g) to high density. The graph in the lower portion of the picture displays the g values of individual radio sources as a function of solar elongation. |
Corotating Streams
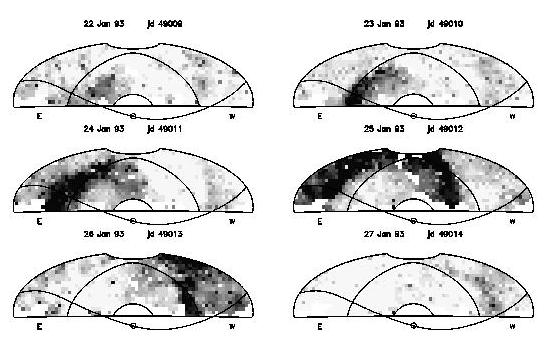
The IPS image sequence below shows a typical corotating stream as it approaches the Earth and engulfs us on 24/25 January 1993. A postscript version of this image is also available. For details see 'Observations of long-lived solar wind streams during 1990--1993', Annales Geophysicae, 13, 227--236.
 |
| 1990 |
|
|
|
|
|
|
|
|
|
|||
|
|
|
|
|
|
|
|
|
|
|
|
|
|
|
|
|
|
|
|
|
|
|
|
|
|
|
|
|
|
|
|
|
|
|
|
|
|
|
| 1990 |
|
|
|
|
|
|
|
|
|
|||
|
|
|
|
|
|
|
|
|
|
|
|
|
|
|
|
|
|
|
|
|
|
|
|
|
|
|
|
|
|
|
|
|
|
|
|
|
|
|